Convergence on gender equality in the EU
One of the fundamental objectives of the EU is to improve the lives of its citizens by promoting upward economic and social convergence (European Commission, 2016b; European Parliament, 2018b), with the European Pillar of Social Rights serving as a compass for the renewed process of convergence across Europe. In addition to monitoring the convergence of socioeconomic outcomes such as gross domestic product (GDP), incomes, poverty or employment, it is also relevant to analyse and monitor convergence as regards gender equality.
This chapter provides the first attempt to analyse the degree of convergence on gender equality in the EU between 2005 and 2017. Convergence is the tendency of Member States to become more alike over time. Therefore, the analysis conducted shows whether the Gender Equality Index scores of the Members States are moving towards the same level of achievement and to what extent a gradual reduction of disparities is being achieved in the process. Following the methodology proposed by Eurofound (2018c) in monitoring convergence, the first step is to examine the trend of the Gender Equality Index at EU level, which is followed by an analysis of the convergence and divergence patterns in each Member State towards the EU (see Annex 4 for further methodological details). Subsequent analysis is needed to assess convergence on different domains, sub-domains and indicators and will be provided in future editions of the Gender Equality Index.
Trend at the EU level
Longer-term developments at the EU level regarding the variation between the Member States in the Gender Equality Index score from 2005 to 2017 are presented in Figure 5. It shows the average of the Gender Equality Index score for the 28 Member States (left axis) in comparison to the trend in the cross-Member State variability (right axis)[1]. The figure shows that the mean improvement in the Gender Equality Index in this period, rising from 62.0 to 67.4 points, was accompanied by an overall decline in variation. This implies that, on average, differences between Member States decreased.
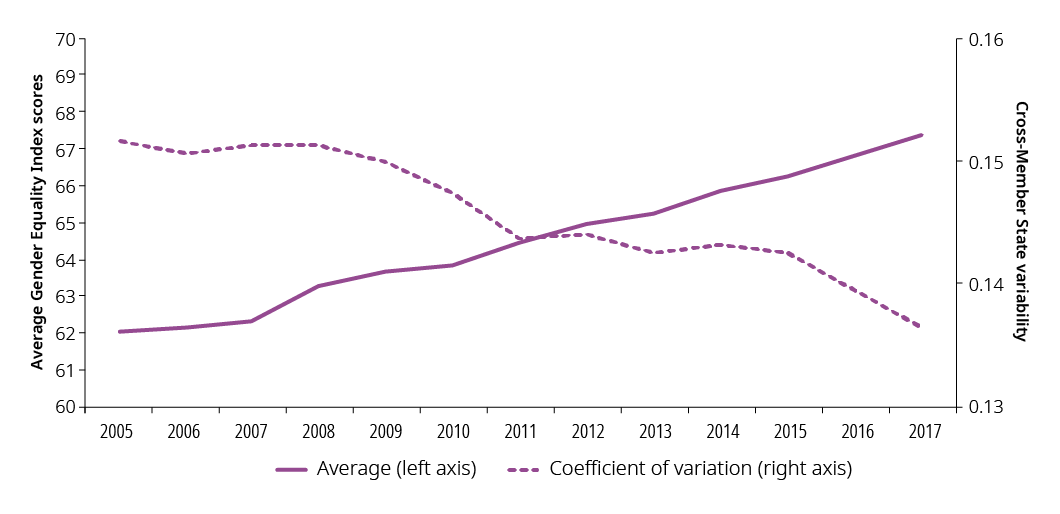
Figure 5: Average and dispersion in the Gender Equality Index, EU-28, 2005-2017
An increase in Gender Equality Index score, together with reduced cross-Member State disparities between 2005 and 2017, point to a trend of upward convergence. Nonetheless, Table 3 shows that periods of upward divergence could be spotted in certain years within this period. This means that while there is a general increase in the Gender Equality Index scores, the disparities between Member States widened when some Member States outperformed others during some periods (2006-2007; 2011-2012; and 2013-2014). These findings show the importance of monitoring annual progress across the Member States if a common objective of gender equality in the EU is to be achieved in a smooth and gradual way.
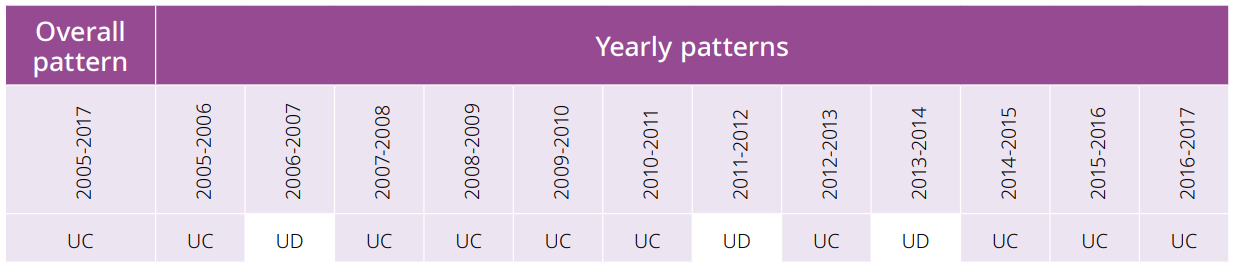
Table 3: Convergence patterns (EU, 2005-2017)
Note: Upward convergence (UC) — mean improvement in performance and reduction of disparities among Member States; upward divergence (UD) — mean improvement in performance together with an increase in disparities among Member States.
Further analysis suggests that the worst-performing Member States were catching up with the best-performers over the period. Member States with higher initial levels of gender equality in 2005, such as Sweden, Denmark or Finland (indicated by their position on the x-axis of Figure 6), showed slower growth in subsequent years (indicated by their position on the y-axis). In comparison, Member States with lower initial Index scores, such as Cyprus, Greece or Italy, showed faster growth rates on gender equality.
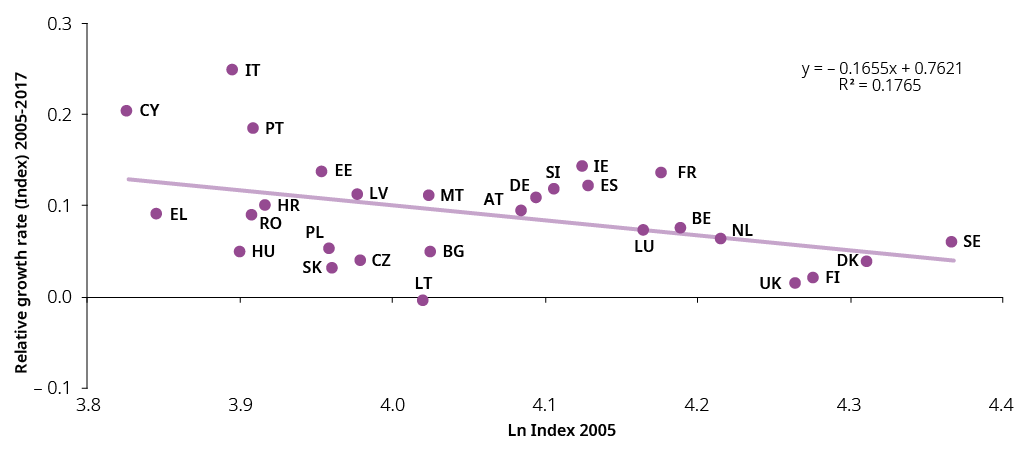
Figure 6: Beta convergence among EU Member States, 2005-2017
Although the results of the convergence analysis suggest a gradual narrowing of gaps on gender equality in the EU between 2005 and 2017, they do not shed light on the different developments at Member State level. For instance, despite an average increase in the Gender Equality Index score during this period, not all of the Member States registered an improvement. This is known as upward convergence in the weak sense (Eurofound, 2017b).
Convergence and divergence patterns of Member States 2005-2017
To see how the developments in the Gender Equality Index of individual Member States compare to the EU average, a systematic mapping of the patterns was carried out on the basis of the following information: (1) EU average performance (improvement or worsening); (2) Member State performance (improvement or worsening); (3) relative Member State performance in relation to the EU average (better or worse); and (4) relative Member State speed in relation to the EU average (faster or slower). As a result, EU Member States displayed five different patterns of convergence or divergence patterns during the 2005-2017 period[2].
- Catching up. Estonia, Germany, Italy, Cyprus, Latvia, Malta, Austria, Portugal and Slovenia registered Index scores lower than the EU average, but their scores improved more quickly than the EU mean, narrowing the gap between them over time.
- Flattening. Belgium, Denmark, Luxembourg, the Netherlands, Finland, Sweden and the United Kingdom had gender-equality scores higher than the EU average but their improvement was slower than the EU average. Over time, the gap between these Member States and the EU reduced.
- Outperforming. France, Ireland and Spain started with higher scores than the EU average and grew at a faster rate in the ensuing years, increasing the gap between them and the EU.
- Slower pace. Bulgaria, Croatia, Czechia, Greece, Hungary, Poland, Romania and Slovakia improved their Gender Equality Index scores. However, with initially significantly lower scores than the EU average, their slower rate of progress during the period ensured growing disparities between them and the EU over time.
- Diving. Lithuania was the only Member State, with Gender Equality Index scores lower than the EU whose scores declined as the EU average increased, widening the gap as a result.
Altogether, upward convergence was noted in 16 Member States with catching-up and flattening tendencies, while the remaining 12 Member States displayed various trends of upward divergence (across the three groups of divergence). The evolution of the Index scores at Member State level over the past 12 years in comparison to the EU mean is presented in Figure 7 and Figure 8. In the most recent years, for instance from 2015 to 2017, different patterns have emerged for some Member States. For example, Czechia, Greece, Croatia, Romania and Slovakia were catching up with the EU average.
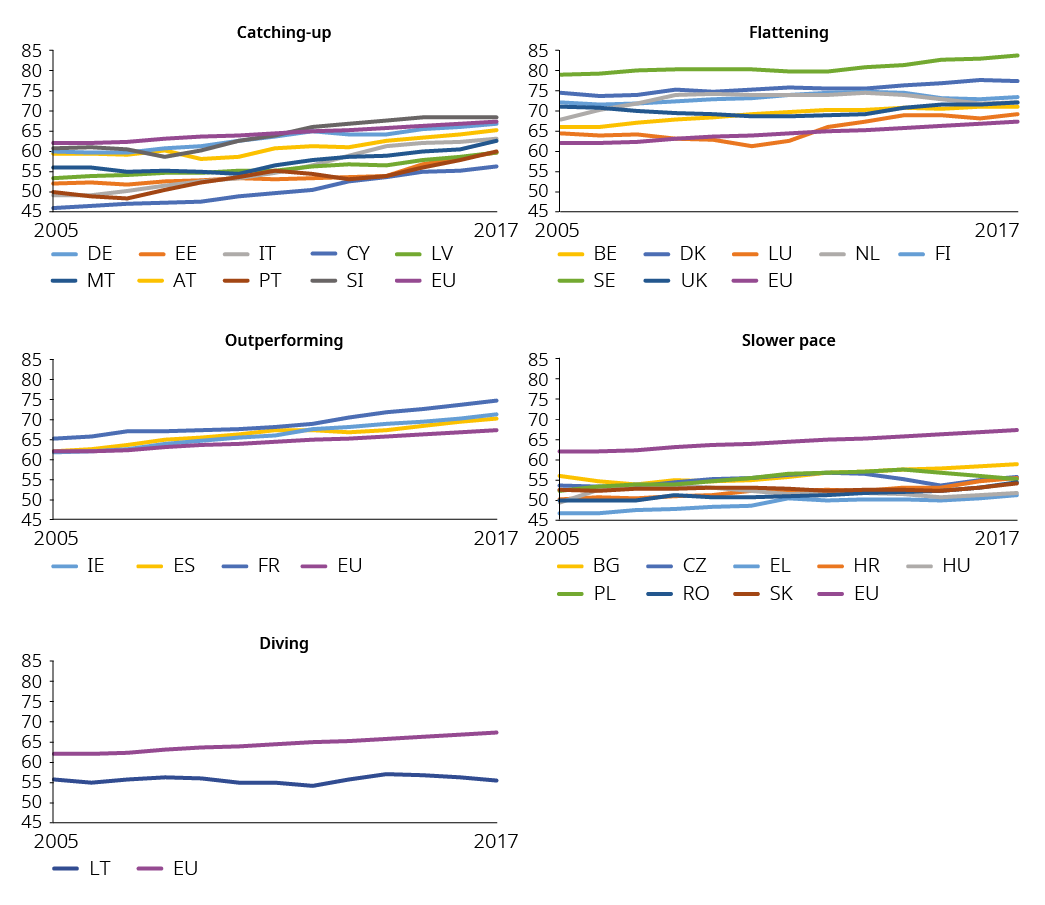
Figure 7: Patterns of convergence of the Gender Equality Index by Member State, scores, 2005-2017

Figure 8: Convergence of the Gender Equality Index by Member State, scores, 2005-2017