Women live longer but in poorer health
A baby girl born in the EU in 2017 can expect to live to the age of 84, compared to 78 years for a baby boy. While the gender difference in life expectancy at birth stands at 6 years on average in the EU, it reaches 11 years in Lithuania. The ‘mortality advantage’, the phenomenon of women’s higher life expectancy, is attributed to a series of biological, socioeconomic and cultural factors (WHO, 2016). Among them, dominant masculinity norms often account for the higher prevalence of certain types of risky behaviour, with higher exposure to certain risks leading to higher morbidity among men (WHO, 2018). Through socialisation, boys and men are encouraged to rely on themselves, to act ‘tough’ through substance abuse or suppressing emotions or pain, and to demonstrate their heterosexuality by engaging with multiple sexual partners (Kågesten et al., 2016). As a result, men in the EU are twice as likely to die of accidents as women and four times more likely to die of alcohol abuse and drug dependence[1]. Similarly, significantly more men die of suicide: 4.85 women per 100 000 inhabitants compared to 17.85 men[2].

While women outlive men in general, there are significant differences between various social groups of women. Studies show that women with a tertiary-level education live longer than those with a lower level of qualifications (WHO, 2016). A lower level of education, combined with lower socioeconomic status, can, therefore, be contributing factors to the shorter life expectancy of Roma women in comparison with women from the population at large (European Public Health Alliance, 2018). These and other avoidable health inequities across different socioeconomic groups ‘usually result from the uneven distribution of social and environmental determinants; the differential access to resources such as education, employment, housing, health services; different levels of participation in society and different levels of control over life’ (European Public Health Alliance, 2018, p. 1).
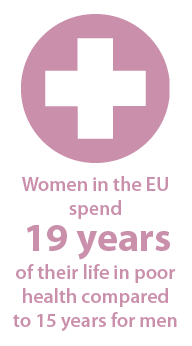
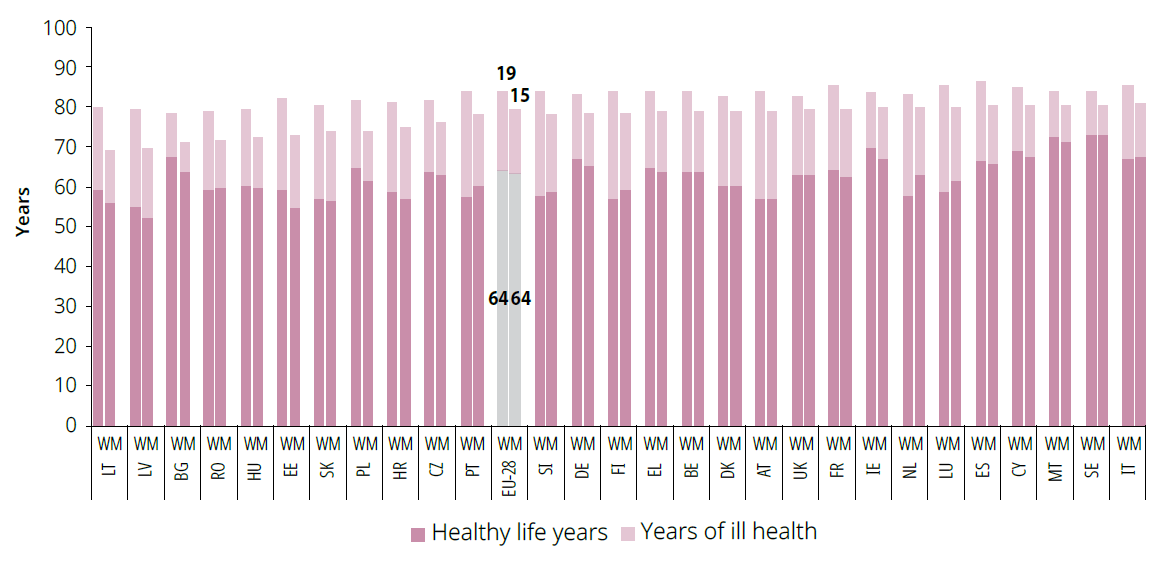
The ‘mortality advantage’ that women in the EU are said to have over men is offset by the fact that they spend a greater share of their life in ill health (WHO, 2016). On average, in the EU, 77 % of women’s and 81 % of men’s life is spent in good health (as a percentage of life expectancy). This ‘morbidity disadvantage’ means that in 2016, for example, women in the EU spent 19 years of their life in poor health compared to 15 years for men (Figure 30). In seven Member States (AT, FI, LU, LV, NL, PT, SI) women spent 25 years or more in poor health. The gender differences in ill health are of added significance because of the demographic changes of an ageing and feminised population. While the largest age cohort for both women and men in 2016 was 45-49 years, it will be 50-54 years for men and 70-74 years for women by 2070. Overall, the median age will rise by 4 years for both men and women by then (European Commission, 2018a). Considering the challenges posed by ageing populations, a diminishing workforce and pressures on welfare systems, gender-specific measures would effectively contribute to solving health-related differences between women and men with knock-on socioeconomic effects.
As shown in Figure 30, women and men in the EU can expect to live in good health until the age of 64. This is an additional 2.8 years of healthy life for women and 3.6 years for men since 2005, and an extra 9 months for both women and men since the 2017 Index. At the Member State level, the number of healthy life years increased for men in 19 Member States and for women in 15 Member States. The extent of progress or setbacks varied greatly across Member States, with Denmark showing the most significant regression for both women’s and men’s health (– 8.1 p.p.). This was followed by the Netherlands (–5.7 p.p. for women, – 2.6 p.p. for men). Six Member States saw the number of healthy years of life for women increase by more than 5 p.p. since 2005 (DE, CY, SE, EE, HU, IE), with the biggest gains made by Cyprus (+ 5.4 p.p. for women and + 4.4 p.p. for men) and Italy (+ 4.5 p.p. and + 5 p.p. for men). This diversity highlights the need for increased and integrated EU efforts to tackle gender inequities in health and to promote gender transformative health strategies (WHO, 2016, p. 76).
Figure 30: Healthy life years and years of ill health of women and men, by EU Member State (in years), 2016
Note: ‘Years of ill health’ is defined as a difference between ‘life expectancy at birth’ and ‘healthy life years’. Healthy life years and years of ill health add up to expected life expectancy at birth.
