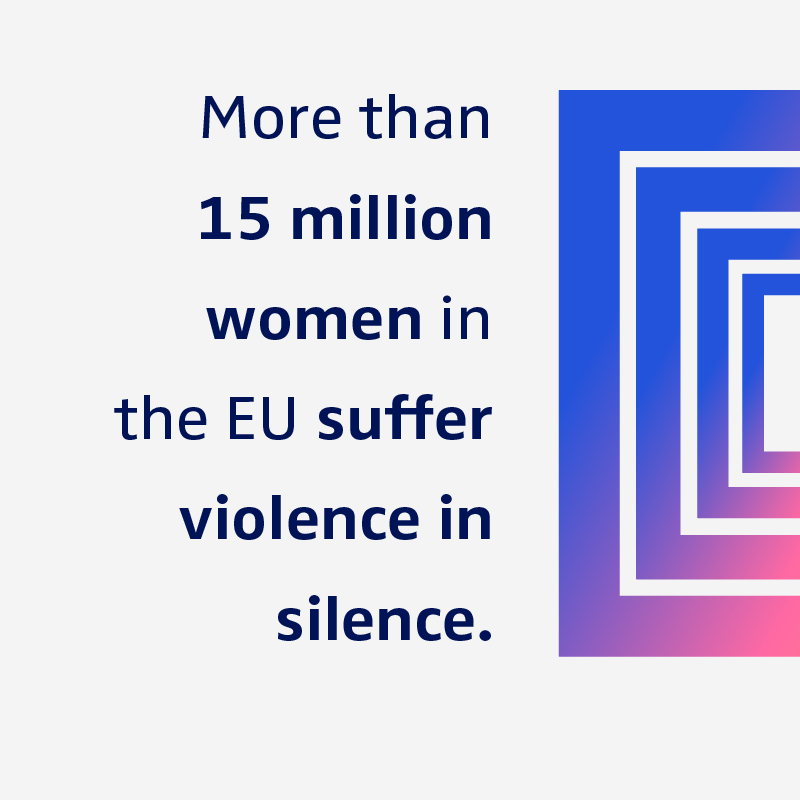
One in three women in the EU experience violence.
With devastating long-term consequences.
Gender-based violence - It should be zero.
The EU gender-based violence survey helps us to understand the shocking levels of violence against women. It shows we need to act. Member States must do more to prevent violence against women and to protect them when it happens.
Understanding the scale of the problem
The biggest ever EU survey on violence against women showed that:
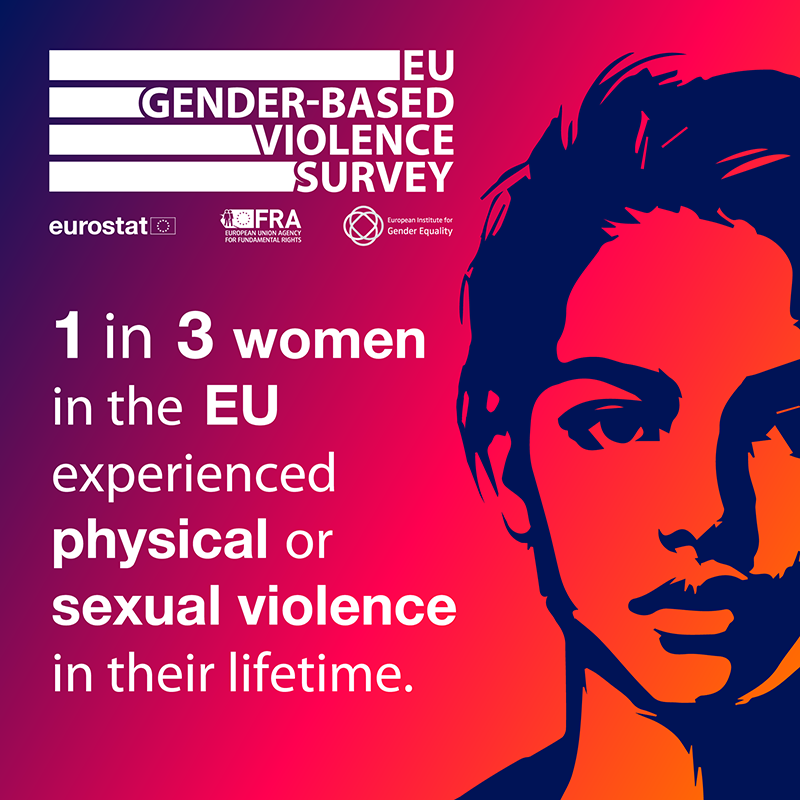
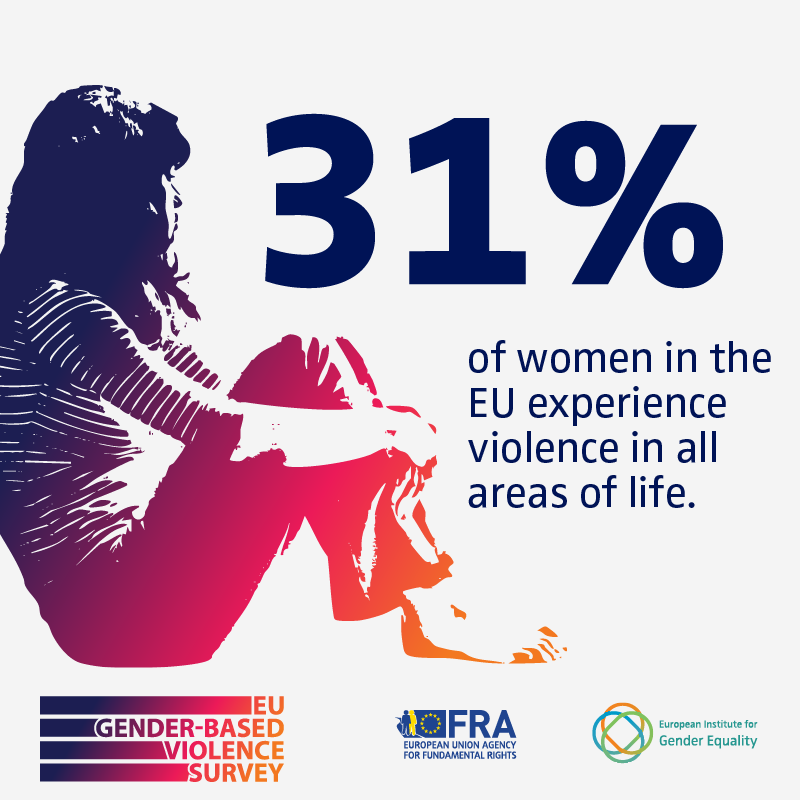
- 31% of women experienced physical or sexual violence in their lifetime
- Women who experienced sexual violence in childhood are more than three times as likely to be abused as adults
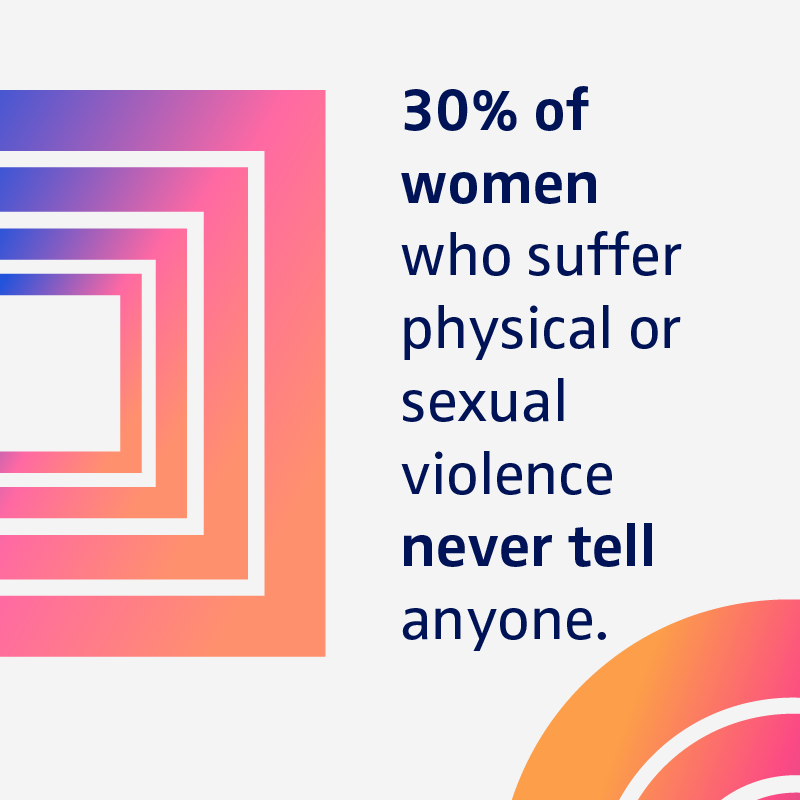
- Half of women who suffered violence from their partner never told anyone
Women in the EU experience violence in all areas of life
Five shocking findings from the biggest-ever EU gender-based violence survey which drew on responses from almost 115,000 women across the EU.
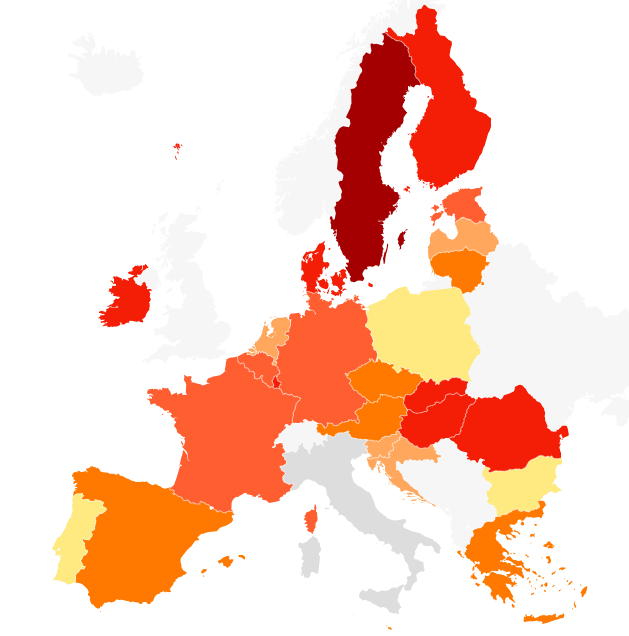
Mapping violence against women
Explore our interactive heatmaps to see how the prevalence of various forms of violence varies among the EU Member States.
- Women who have experienced physical violence or threats and/or sexual violence by any perpetrator in their lifetime
- Women who have experienced physical violence or threats and/or sexual violence by an intimate partner in their lifetime
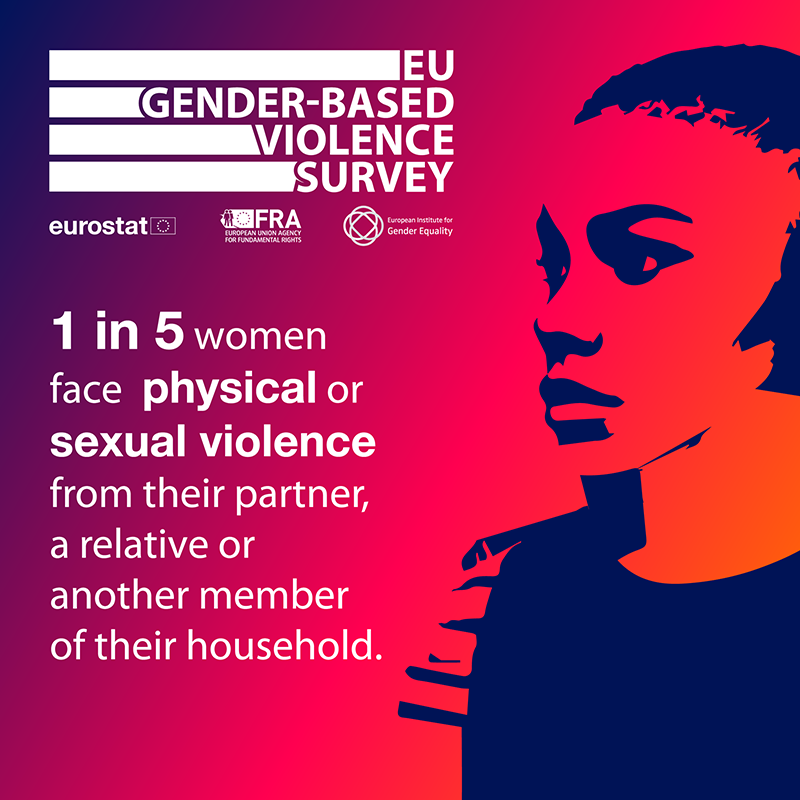
- Women who have experienced physical violence or threats, sexual violence and/or psychological violence by an intimate partner in their lifetime
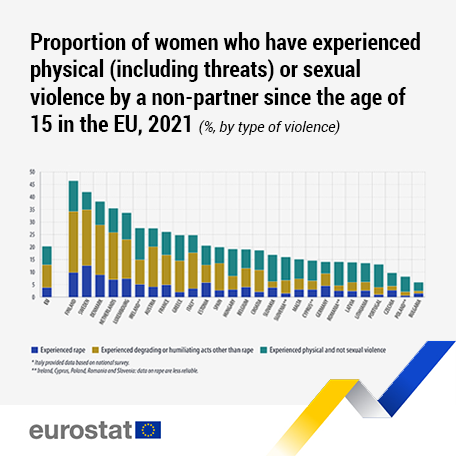
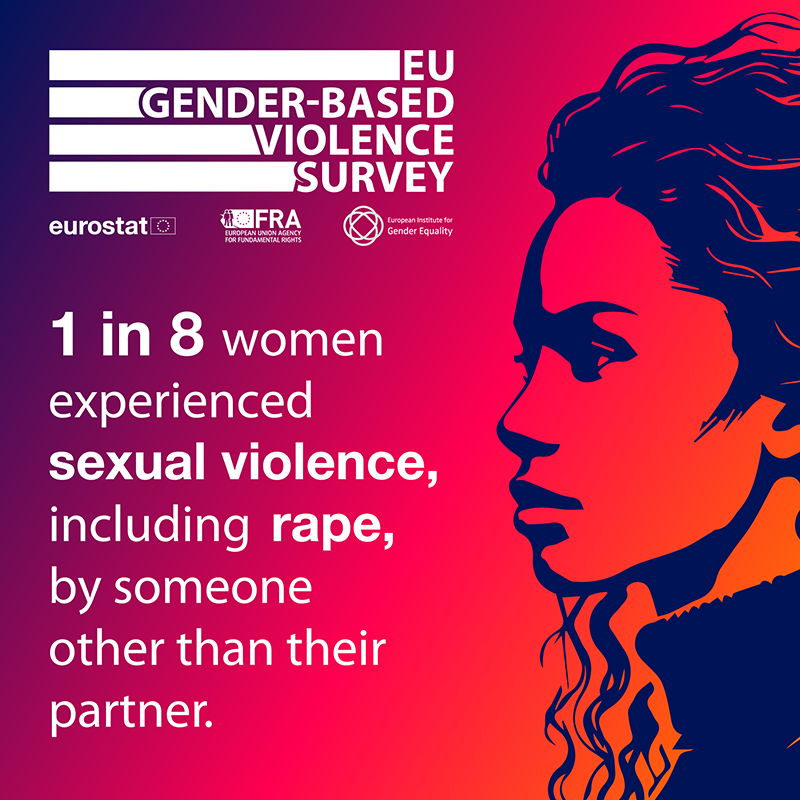
- Women who have experienced physical violence or threats and/or sexual violence by someone other than their intimate partner, since the age of 15
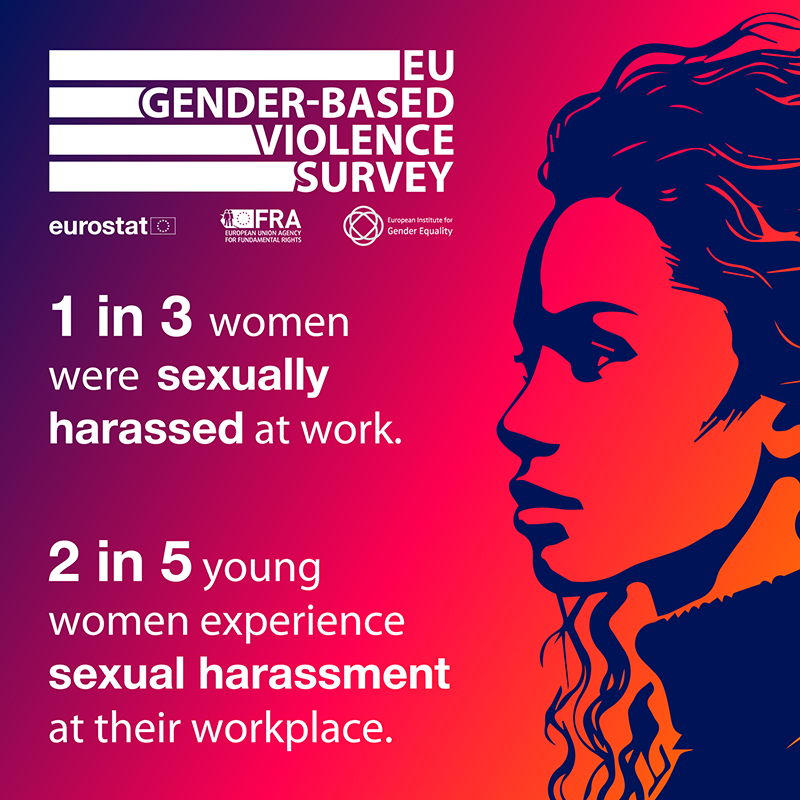
- Women who have experienced sexual harassment at work in their lifetime

| Member State | Percentage of WOMEN WHO HAVE EXPERIENCED PHYSICAL VIOLENCE OR THREATS AND/OR SEXUAL VIOLENCE BY ANY PERPETRATOR IN THEIR LIFETIME |
|---|---|
| Belgium | 29.1 |
| Bulgaria | 11.9 |
| Czechia | 19.7 |
| Denmark | 47.5 |
| Germany | 25.6 |
| Estonia | 33.1 |
| Ireland | 40.7 |
| Greece | 36.5 |
| Spain | 28.2 |
| France | 34.5 |
| Croatia | 25.3 |
| Italy | 31.7 |
| Cyprus | 36.1 |
| Latvia | 25.1 |
| Lithuania | 25.2 |
| Luxembourg | 45.4 |
| Hungary | 49.1 |
| Malta | 24.4 |
| Netherlands | 41.2 |
| Austria | 35.7 |
| Poland | 16.7 |
| Portugal | 19.7 |
| Romania | 42.2 |
| Slovenia | 22.5 |
| Slovakia | 37.9 |
| Finland | 57.1 |
| Sweden | 52.5 |
| EU-27 | 30.7 |

| Member State | Percentage of WOMEN WHO HAVE EXPERIENCED PHYSICAL VIOLENCE OR THREATS, SEXUAL VIOLENCE AND/OR PSYCHOLOGICAL VIOLENCE BY AN INTIMATE PARTNER IN THEIR LIFETIME |
|---|---|
| Belgium | 17.1 |
| Bulgaria | 9.3 |
| Czechia | 13.4 |
| Denmark | 25.7 |
| Germany | 15.8 |
| Estonia | 21.8 |
| Ireland | 22.7 |
| Greece | 21.7 |
| Spain | 14.4 |
| France | 17.7 |
| Croatia | 12.7 |
| Italy | 13.6 |
| Cyprus | 30.0 |
| Latvia | 16.1 |
| Lithuania | 16.6 |
| Luxembourg | 26.6 |
| Hungary | 41.1 |
| Malta | 14.6 |
| Netherlands | 16.7 |
| Austria | 17.1 |
| Poland | 11.2 |
| Portugal | 10.3 |
| Romania | 37.0 |
| Slovenia | 13.4 |
| Slovakia | 30.7 |
| Finland | 33.8 |
| Sweden | 31.0 |
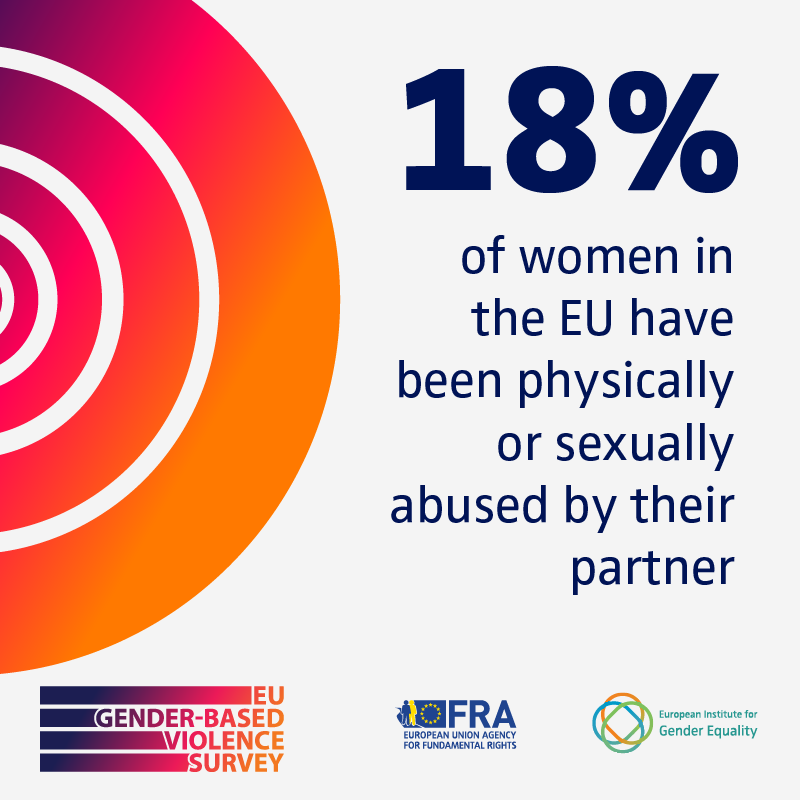
| EU-27 | 17.7 |

| Member State | Percentage of WOMEN WHO HAVE EXPERIENCED PHYSICAL VIOLENCE OR THREATS, SEXUAL VIOLENCE AND/OR PSYCHOLOGICAL VIOLENCE BY AN INTIMATE PARTNER IN THEIR LIFETIME |
|---|---|
| Belgium | 31.3 |
| Bulgaria | 20.5 |
| Czechia | 33.5 |
| Denmark | 45.0 |
| Germany | 31.9 |
| Estonia | 41.2 |
| Ireland | 35.0 |
| Greece | 41.8 |
| Spain | 28.6 |
| France | 30.2 |
| Croatia | 28.1 |
| Italy | 25.9 |
| Cyprus | 44.5 |
| Latvia | 30.1 |
| Lithuania | 30.7 |
| Luxembourg | 47.4 |
| Hungary | 54.6 |
| Malta | 26.0 |
| Netherlands | 33.4 |
| Austria | 37.8 |
| Poland | 19.6 |
| Portugal | 22.5 |
| Romania | 48.9 |
| Slovenia | 27.9 |
| Slovakia | 50.8 |
| Finland | 52.6 |
| Sweden | 48.2 |
| EU-27 | 31.8 |

| Member State | Percentage of WOMEN WHO HAVE EXPERIENCED PHYSICAL VIOLENCE OR THREATS AND/OR SEXUAL VIOLENCE BY SOMEONE OTHER THAN THEIR INTIMATE PARTNER, SINCE THE AGE OF 15 |
|---|---|
| Belgium | 19.1 |
| Bulgaria | 5.9 |
| Czechia | 9.7 |
| Denmark | 38.2 |
| Germany | 14.1 |
| Estonia | 20.6 |
| Ireland | 27.6 |
| Greece | 24.8 |
| Spain | 20.0 |
| France | 26.1 |
| Croatia | 18.7 |
| Italy | 24.8 |
| Cyprus | 14.6 |
| Latvia | 13.9 |
| Lithuania | 13.6 |
| Luxembourg | 33.7 |
| Hungary | 19.2 |
| Malta | 15.1 |
| Netherlands | 35.5 |
| Austria | 27.5 |
| Poland | 8.2 |
| Portugal | 13.1 |
| Romania | 14.1 |
| Slovenia | 16.0 |
| Slovakia | 16.9 |
| Finland | 46.5 |
| Sweden | 42.0 |
| EU-27 | 20.2 |

| Member State | Percentage of WOMEN WHO HAVE EXPERIENCED SEXUAL HARASSMENT AT WORK |
|---|---|
| Belgium | 32.9 |
| Bulgaria | 12.2 |
| Czechia | 30.5 |
| Denmark | 46.4 |
| Germany | 32.1 |
| Estonia | 33.3 |
| Ireland | 44.0 |
| Greece | 42.6 |
| Spain | 28.2 |
| France | 41.1 |
| Croatia | 36.4 |
| Italy | 14.8 |
| Cyprus | 39.9 |
| Latvia | 11.0 |
| Lithuania | 19.1 |
| Luxembourg | 52.9 |
| Hungary | 40.1 |
| Malta | 27.1 |
| Netherlands | 40.9 |
| Austria | 26.6 |
| Poland | 13.0 |
| Portugal | 12.3 |
| Romania | 32.5 |
| Slovenia | 31.7 |
| Slovakia | 53.0 |
| Finland | 53.7 |
| Sweden | 55.4 |
| EU-27 | 30.8 |
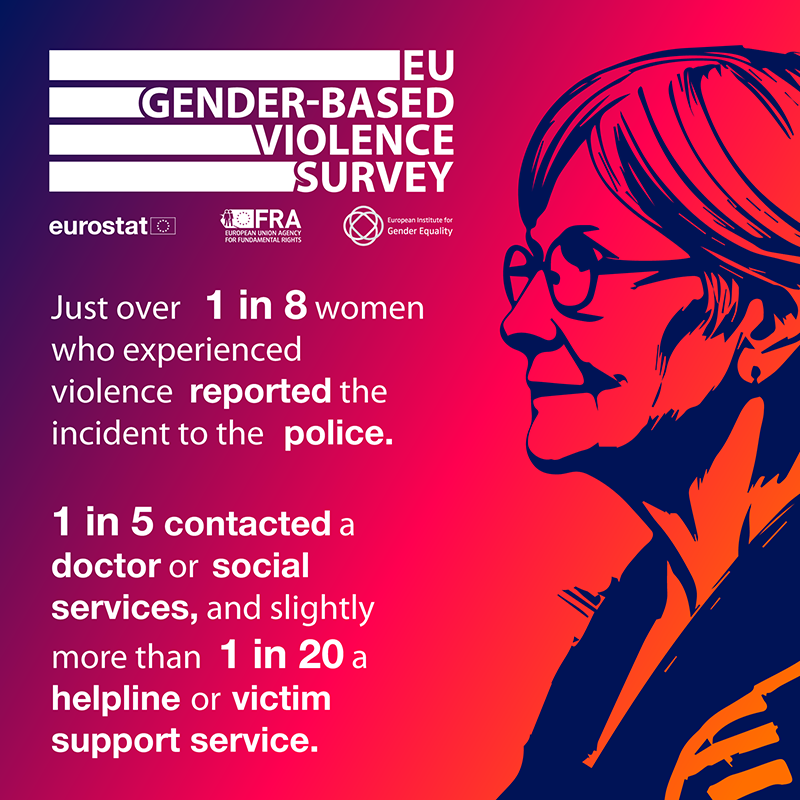
Member States must build systems which protect and support women
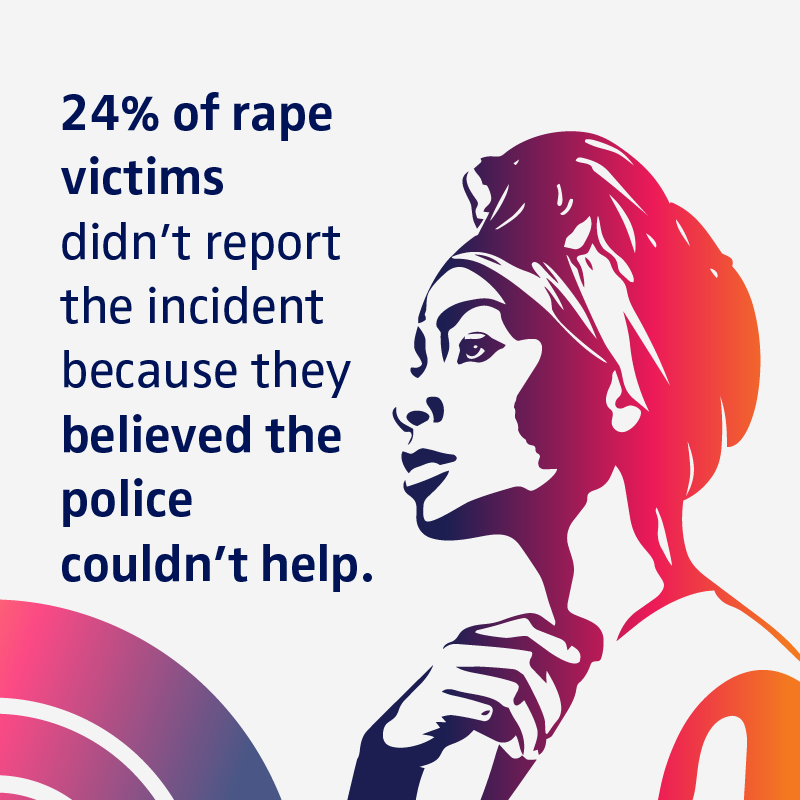
Only a quarter of victims in the survey reported physical and/or sexual violence to police, healthcare or social services or other organisations such as victim support.
Policymakers should change the way that healthcare, education, legal and support services operate to make women feel more comfortable coming forward to share their experiences. With victim-appropriate and gender-sensitive training where required.
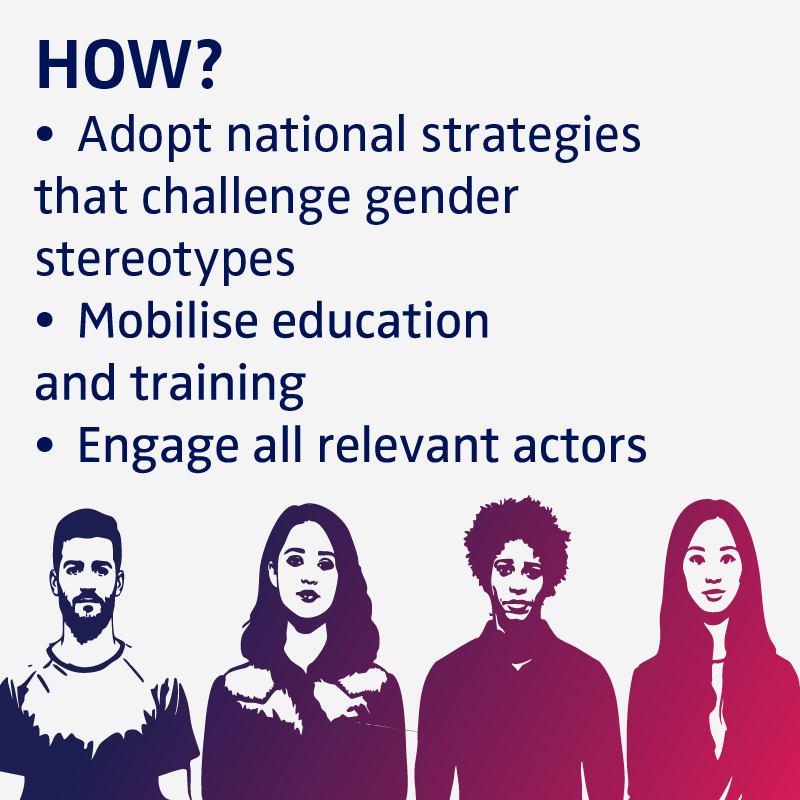
Preventing and eliminating gender-based violence should be a top priority
Violence against women ruins lives. Effective prevention strategies should be rolled out across the EU. Investing in education, tackling gender-inequalities and stereotypes and co-ordinated multi-sector action works.
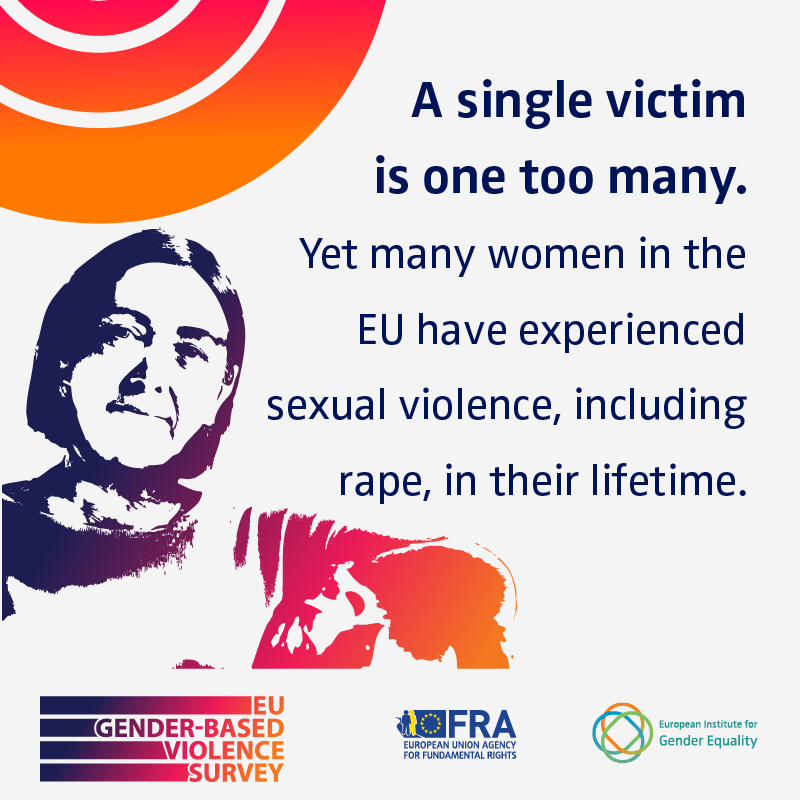
It should be zero
17% of women in the EU are victims of sexual violence in their lifetime. Almost twice as many women reported being raped when “unable to refuse or under coercion” than when “force or threats” were used.
Sexual harassment at work is more common than we think
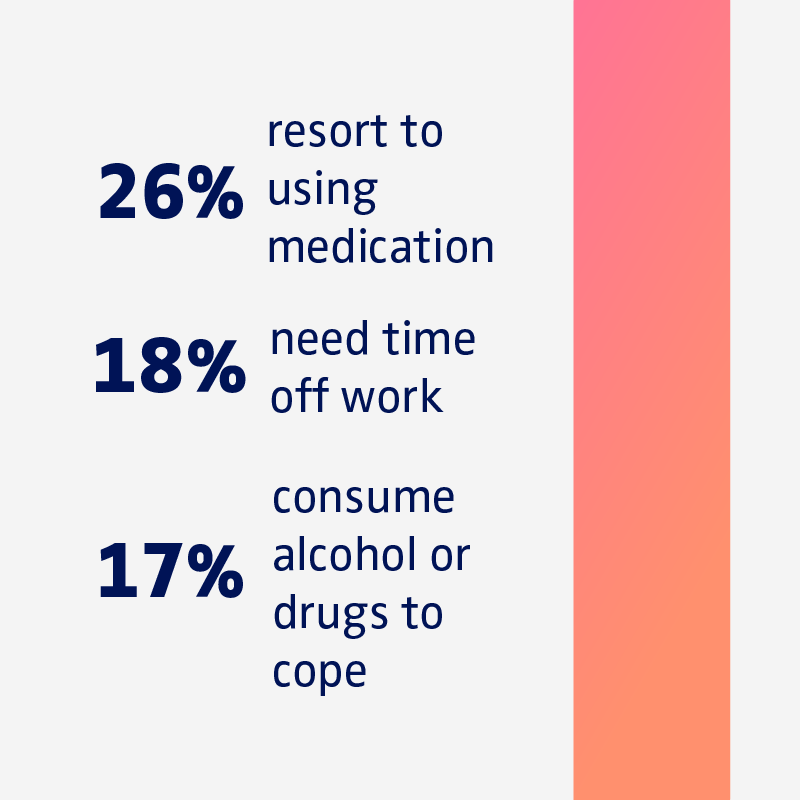
And it threatens our health, wealth and well-being.
Imagine starting your career full of promise, only to be silenced, sidelined, or made ill by unwanted sexual behaviour. This is the reality for millions of women across Europe.